Same filters.
Same factory.
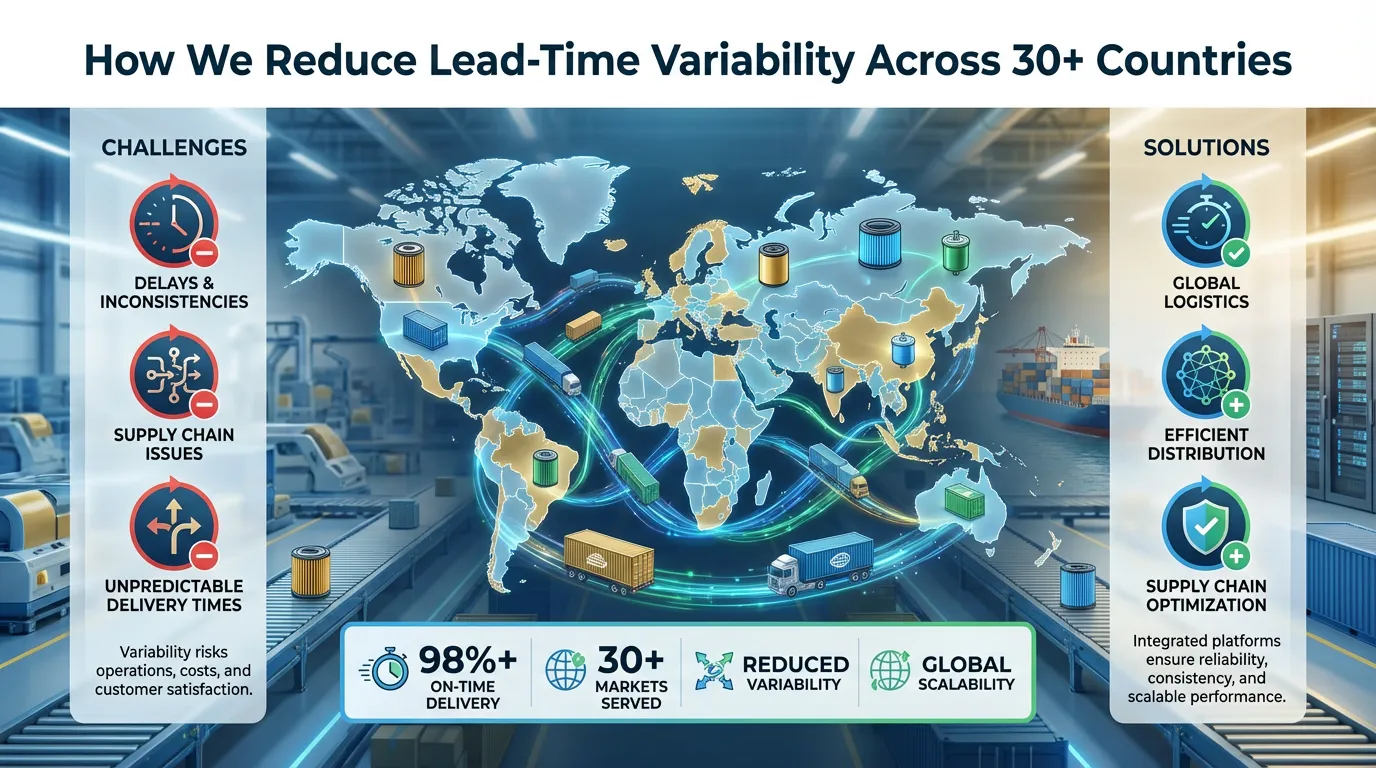
But very different lead times to each country. 🌍
Not because production is slow.
Because variability kills planning.
Most distributors don’t just ask:
They ask:
- “Can I trust the lead time in my system?”
If your ERP says 45 days but the actual lead time swings between 40 and 80 days, it becomes very hard to:
- Plan stock
- Commit to customers
- Manage cash flow
At Beling Filters, we ship to 30+ markets and focus not only on speed, but on predictability.
In this article, you’ll see how we try to make lead time more predictable across multiple countries by:
- Separating factory time from door-to-port time
- Using historical data, not feelings
- Adding buffers only on high-risk routes
- Aligning order patterns with capacity
- Providing transparent updates instead of silence
-
Separate Factory Time and Door to Port Time for Filter Shipments 🏭🚢
(Why Mixing Everything Into One Number Creates Confusion)
One of the biggest sources of confusion is a single, mixed lead time number.
If you say “lead time = 70 days” without explaining what’s inside that number, then:
- A delay at the factory
- A port congestion problem
- A vessel schedule change
all look the same to the distributor: “supplier is slow”.
To manage expectations better, we always split the lead time into components:
- Production + internal QC time
- Documentation + booking time
- Sea/air transit + local port situation
1.1 Typical Factory Lead Time for Automotive Filters
For filters, a typical stable base for us is:
- 30–40 days production + QC for regular orders
- 3–5 days for documentation and booking (when vessel space is normal)
These parts are directly under our control:
- Production planning
- Quality checks
- Document preparation
- Booking request submission
We treat this “factory + document time” as a baseline that we aim to keep stable for each repeat order.
1.2 Adding Port-to-Port Transit Time on Top
Once we know:
- Production finish date
- Target port
- Usual route
we add a realistic transit estimate based on your port and route history, for example:
- Shanghai → Jebel Ali
- Ningbo → Santos
- Shanghai → Hamburg
Instead of giving one vague number like “around 70 days”, we break it down:
- X days factory lead time
- Y days transit time
This way, if there is a delay, we can clearly say:
- “This delay came from production” or
- “This delay came from the shipping side”
and you can adjust internal KPIs and customer communication accordingly.
-
Use Historical Data, Not Feelings, to Estimate Lead Time 📊
(What Actually Happened in the Last Shipments)
Many suppliers still give lead time estimates based on feelings:
- “Normally it’s about 30 days…”
- “Usually it takes 45 days…”
But in real logistics, “normal” is not enough.
We track, for each key destination:
- Average time from PO → shipment ready
- Average time from ETD (Estimated Time of Departure) → ATA (Actual Time of Arrival) at port
- Seasonal peaks and disruptions (pre Chinese New Year, Q4 rush, local public holidays, port strikes, etc.)
2.1 Why Historical Data Matters to Distributors
For your planning team, it’s important to know:
- Is the lead time estimated based on real lanes and real data, or just a generic guess?
- How stable is this lane in practice?
- How much variation has there been in the past 6–12 months?
When you use data from actual shipments, your team can:
- Build more accurate ERP parameters
- Plan safety stock based on real variability, not imagined worst cases
- Justify lead time promises to your own customers
2.2 Examples of Lead Time Estimates Based on Real Data
If we tell a distributor:
- “Around 40 days factory lead time”
- “Plus 25–30 days to Jebel Ali”
- “Plus 35–40 days to Santos”
these numbers are based on:
- What actually happened for similar shipments
- Observed transit times and port behavior
- Seasonality for those routes
We continuously update our internal view when:
- A port becomes more congested
- A carrier changes schedule
- A new route performs better or worse
This data-driven approach helps us give fewer fake promises and more realistic windows.
-
Add Lead Time Buffer for High Risk Routes, Not for All Lanes ⚠️
(Avoid Making Every Route Look Slow and Uncompetitive)
If we add a big safety buffer to every route, then:
- All lead times look slow
- You lose competitiveness
- Your planning system becomes pessimistic
Instead, we focus on targeted buffers.
We:
- Identify ports with frequent congestion, strikes or weather issues
- Add extra buffer only on those high-risk lanes
- Share best case / realistic / risk case windows instead of a single number
3.1 How We Classify Routes by Risk
For each major route, we look at:
- Average transit time vs. schedule
- Frequency of delays over a certain threshold (e.g. +7 days)
- Known issues like labour strikes, monsoon seasons, or recurring congestion
Then we classify routes, for example:
- Low variability routes – mostly stable, minor delays
- Medium variability routes – some seasonal fluctuation
- High variability routes – frequent and unpredictable delays
3.2 Example of Practical Lead Time Windows
For example, we might tell a distributor:
- “SEA route in normal months: 25–30 days”
- “Before Chinese New Year: please plan 10–15 days extra”
We use different wording like:
- Best case – when everything goes smoothly
- Realistic – what usually happens
- Risk case – what to expect in peak or disruption seasons
This helps distributors plan:
- Stock build-up before peak seasons
- Shipments earlier for high-risk periods
- Customer promises that reflect real risk levels, not only optimistic scenarios
-
Align Order Patterns With Production Capacity for Stable Lead Times 📅
(Why Lead Time Variability Grows When Orders Come in Waves)
Lead time variability is not only about ships and ports.
It also comes from order patterns.
If orders arrive:
- In big, irregular spikes
- With short notice for large volumes
- Concentrated around the same weeks as everyone else
then even a normally stable factory will show variable lead times.
4.1 Typical Problems When Orders Come in Waves
When distributors send large or irregular orders, we see:
- Sudden pressure on production lines
- Competing priorities between customers
- Longer queues for QC and packing
- Higher risk that some POs miss the intended vessel
This often happens:
- Just before Chinese New Year
- In Q4 when many markets rush to close the year
- Before major tenders or promotions
4.2 How We Align Orders and Capacity With Long-Term Partners
To keep lead time smoother, we:
- Encourage regular order cycles
- Monthly or quarterly ordering instead of irregular spikes.
- Reserve capacity for stable partners
- We block a certain capacity share for customers who provide predictable patterns.
- Pre-discuss big promotions or tender volumes
- So we can plan production and materials ahead of time.
For some partners we even keep:
- Agreed forecast windows (e.g. rolling 3–6 month forecast)
- Priority slots during busy seasons
This means their lead time does not suddenly jump from 45 to 75 days just because the global market is noisy.
You get:
- More stable factory lead time
- More predictable availability for key references
- Better alignment between your sales plans and our production plans
-
Transparent Lead Time Updates Instead of Silence 📡
(Because Silence Makes Variability Feel Worse)
Even with the best planning, global trade will never be perfectly stable.
What makes the experience much worse is silence.
If the ETD changed, or the vessel was rolled, but nobody told you early, then:
- Your team still plans based on the old date
- Your customer asks where the shipment is
- You discover the delay too late to adapt
We try to reduce this uncertainty by sharing updates at key points.
5.1 Key Lead Time Milestones We Communicate
For our filter shipments, we usually update distributors at these stages:
- PO received & production slot scheduled
- You know when your order entered the plan.
- Production finished & waiting for vessel
- Factory part of the lead time is complete.
- Vessel booked with ETD & ETA
- You get specific port-to-port timing and carrier info.
- Any deviation vs original plan
- For example, vessel delay, port congestion, roll-over, or documentation change.
5.2 Why Early Visibility Reduces Impact
Even when there is a delay, knowing it early allows you to:
- Adjust customer delivery promises
- Move stock between branches
- Bring forward or delay other orders
- Update your internal lead time data
You may not like the delay, but you can manage it.
Without updates, you get both:
- The delay
- And the surprise
Our goal is to make lead time variability small, explainable and visible, not hidden.
-
Our Goal: Small, Explainable Variations – Not Perfect Stability 🎯
In global trade, “zero variability” is unrealistic.
Ports change.
Weather changes.
Regulations change.
Carrier schedules change.
Our real goal is:
- Small variations, not huge jumps
- Explainable causes, not mystery delays
- Lead times your team can actually plan around
For distributors supplying filters across several countries, what matters is:
- Can you trust the lead time parameters you use in your system?
- Do you understand why lead times change?
- Can you adjust stock and customer commitments in a structured way?
If your current lead times jump from 40 to 80 days without clear reasons, we can:
- Walk through your main lanes together
- Review recent shipment history
- Break down the lead time into factory, documentation and transit
- Identify where variability really comes from
From there, we can:
- Suggest more realistic lead time windows
- Help you adjust ordering patterns
- Share example breakdowns for specific markets
So instead of pushing the same product into 30+ countries with chaotic lead times, you manage a network of lanes with defined behavior.
-
Want an Example of How We Break Down Lead Time for One Market?
If you’d like, we can share an anonymised example of how we break down lead time for a specific market, showing:
- Average factory time
- Typical documentation and booking time
- Recent transit time range
- Seasonal adjustments and buffers
You can use this as a template to:
- Compare against your current ERP settings
- Align your planning team and sales team on realistic timings
- Discuss internally how much safety stock you really need per market
Contact Our Team
Bruce Gong – Key Account Manager, Beling Filters
Email: bruce.gong@belingparts.com
WhatsApp: +86 150 5776 4729
LinkedIn: www.linkedin.com/in/brucegong-beling
We can’t remove all variability from global logistics.
But we can make it visible, manageable and much less painful for your distribution business.