Same country.
Same shipping line.
But one port always feels slower than another.
If you work with auto parts and filters, you’ve probably seen this:
- ETA looks fine on paper
- The schedule from the carrier looks acceptable
- But reality at some ports is very different
Containers sit.
Roll-overs happen.
Customs moves slowly.
Suddenly a “35-day” route turns into 50+ days.
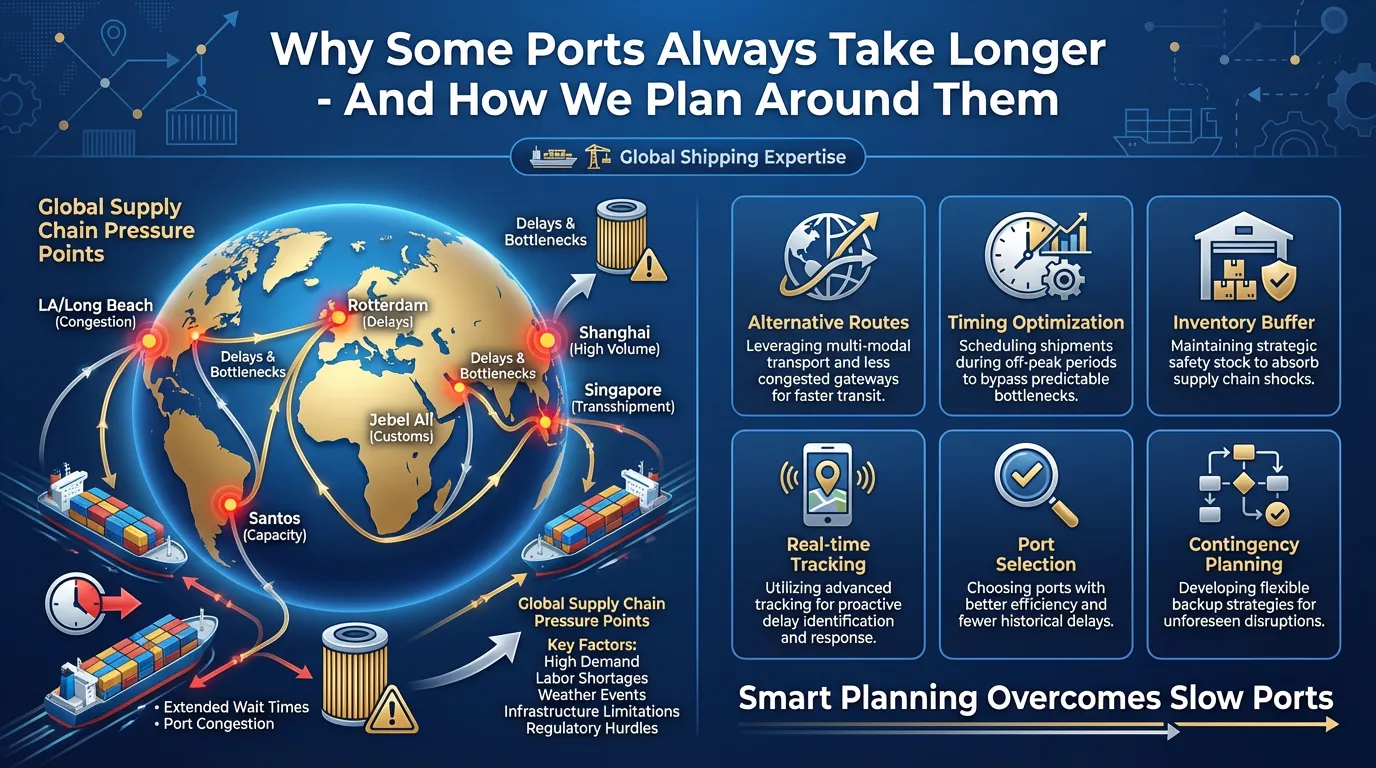
At Beling Filters, we learned that serious auto parts supply chain management means accepting that some ports are structurally slower – and planning around them, instead of constantly fighting fires.
In this article, we’ll share how we look at “slow ports” and how we plan with our partners:
- Not all delays are from the shipping line
- Different ports in the same country, different reality
- Transshipment hubs vs direct routes
- Customs, documentation & local practices
- Building “slow port factors” into stock planning
- Our approach as a long term supplier
If some ports in your network are “famous for being slow”, this framework will help you reduce stress and stockouts instead of chasing every delay as a one-off problem.
-
Not All Delays Are From the Shipping Line at Slow Ports ⚓
(Structural Port Issues vs Carrier Performance)
When a shipment is late, the first reaction is usually:
“The carrier messed up again.”
But many so-called “slow ports” are slow even if the shipping line does everything correctly.
Common structural reasons include:
- Chronic congestion at terminal
- Too many vessels, not enough berths
- Limited yard space
- Limited berthing windows
- Some ports can only receive certain vessel sizes at specific times.
- Peak season overload
- Before major holidays, year-end or local peak seasons, terminals get overwhelmed.
- Slow customs / inspections
- Detailed document checks
- Higher rate of physical inspections
- Less automation
From the importer’s point of view, focusing only on blame doesn’t help. The key questions are:
- “Is this port structurally slower than others?”
- “Is this delay pattern repeating over time?”
If yes, you are not just dealing with one unlucky shipment. You are dealing with a system property, and you need a system solution – especially for auto parts where shelf availability is crucial.
-
Different Ports in the Same Country, Different Reality 🗺️
(Why “Same Market” Does Not Mean Same Lead Time)
We see this pattern often in the auto parts supply chain:
- Port A:
- More direct vessel calls
- Faster vessel turnaround
- Better infrastructure
- Port B:
- More transshipments
- Frequent roll-overs
- Longer dwell time
- Inland ICD / dry port:
- Additional days for rail or truck from the seaport
- Extra handling steps
On paper, both ports are “in the same market” and serve the same region.
In practice, lead time can differ by 7–10+ days.
2.1 Example of Port Choice Impact
Consider an importer of filters and auto parts:
- Port A (main port):
- Heavily used
- Frequent congestion
- Containers often delayed at terminal
- Port B (secondary port):
- Slightly fewer vessels
- But more consistent operations
- Less congestion and more predictable handling
With some partners, we have actually switched:
- From a congested main port
- To a slightly smaller, more predictable port
The result:
- Total lead time becomes more stable, even if ocean freight cost is similar or slightly different.
- Planning becomes easier.
- Less time is spent chasing updates and emergency shipments.
This is why we always separate:
- “Same country” in sales terms
- From “same lead time reality” in logistics terms
A serious auto parts supply chain strategy looks at port-by-port performance, not just country names on a map.
-
Transshipment Hubs vs Direct Routes for Auto Parts & Filters 🌍
(Balancing Cost, Speed and Roll-Over Risk)
For far markets, many shipments move through classic transshipment hubs.
Typically, carriers offer:
- Faster but more expensive routes
- Cheaper but higher roll-over risk routes
3.1 What We Look at in Transshipment Hubs
We pay close attention to:
- How often that hub is congested
- Some hubs are famous for seasonal bottlenecks.
- Typical transshipment waiting time
- Average time containers stay in the hub before being loaded onto the next vessel.
- Seasonality
- Pre-holiday pressure (e.g. Christmas, local festivals)
- Year-end peaks
- Pre–Chinese New Year rush
These factors can add days or even weeks to real transit time, especially when combined with slow destination ports.
3.2 Our Preference for Urgent Auto Parts / Filters
For urgent or critical auto parts and filters, we prefer routes with:
- Fewer transshipment points
- Direct routes when available
- Or at least only one well-performing hub.
- Better historical on-time rate
- Based on our own shipment data and partners’ feedback.
- Slightly higher cost but lower risk
- We accept that freight might be a bit more expensive.
- But we significantly reduce roll-over, missed connections and unexpected delays.
In practice, this often saves more money than a small freight discount because:
- Your shelves stay full
- You avoid emergency airfreight
- You protect your brand reputation in the local market
Reliability is a hidden profit driver in the auto parts supply chain.
-
Customs, Documentation & Local Practices at Slow Ports
📄(When Paperwork and Procedures Become the Bottleneck)
Some ports are slower not because of yard congestion, but because of how customs and local authorities work.
Typical reasons:
- Stricter documentation checks
- Detailed review of invoices, packing lists, certificates.
- Higher rate of physical inspections
- More containers opened and inspected.
- More manual local procedures
- Less digitalisation
- More paper-based steps
As a supplier, we cannot change the government system.
But we can reduce the friction caused by documentation on our side.
4.1 How We Adapt Documentation for Slow Ports
To reduce delays from our side, we:
- Make sure documents are clean and consistent
- No mismatched quantities
- No conflicting descriptions between documents
- Align HS codes and descriptions with your broker
- We follow the classification agreed with the importer’s customs broker.
- This prevents unnecessary questions or reclassification attempts.
- Send documents early for pre-clearance where possible
- Commercial invoice, packing list, certificates shared as soon as available.
- Allows your broker to start clearance preparation before vessel arrival.
4.2 Learning From Partner Feedback
We also collect feedback from partners:
- Which ports need extra certificates (e.g. specific local compliance documents)
- Which ports are sensitive to certain product descriptions or keywords
- Any special warning or notes from local customs brokers
Then we adapt our documents:
- Use wording that is clear and acceptable for that customs environment
- Provide additional supporting documents when needed
This doesn’t make a slow customs office fast – but it reduces surprises and helps avoid avoidable holds caused by documentation.
-
Building “Slow Port Factors” Into Stock Planning for Auto Parts 📦
(Accepting Reality and Planning Around It)
For “slow ports”, we do not pretend the lead time is the same as for “fast ports”.
Instead, with distributors we:
- Add a realistic buffer to transit time
- Adjust safety stock levels at destination
- Plan FCL cycles around typical congestion periods
5.1 Example of Lead Time Planning
A very simple example:
- Normal port:
- Plan based on 35–40 days door-to-door.
- Slow port:
- Plan based on 45–55 days door-to-door.
Instead of planning both markets on a theoretical 35 days and then constantly being surprised, we build the slow port factor into the plan.
5.2 What This Achieves in Practice
By accepting a realistic lead time for slow ports, we can:
- Set higher safety stock levels for those destinations.
- Place FCL orders earlier to avoid stockouts.
- Avoid “always urgent” mode where every shipment is critical.
Your shelves stay full even when the port is having a bad week. 😉
This is especially important for:
- Fast-moving filters and brake parts
- Critical SKUs for workshop partners
- Markets with strong seasonal demand
Better planning around slow ports reduces:
- Emergency shipments
- Last-minute price negotiations
- Internal tension between purchasing, sales and logistics teams
-
Our Approach as a Long-Term Auto Parts & Filter Supplier 📊
(From Raw ETA to Realistic Lead Time by Port)
At Beling Filters, we treat port performance as a data point, not an excuse.
Over time, for major routes we:
- Track actual arrival times by port
- Planned ETA vs actual arrival date.
- Share realistic lead time ranges with partners
- Not just “theoretical transit time” from shipping lines.
- Suggest which ports / routes are more stable
- Based on our shipment history and patterns.
- Adjust packing & container plans based on risk level
- For routes or ports with more risk:
- Stronger packing
- More moisture protection
- More careful container loading plans
We cannot control every delay.
But we can plan smarter and avoid living in “constant crisis mode”.
6.1 Port Lead Time Template: Turning Experience Into a Tool
To make this practical, we use a simple template to record and compare real lead times by port:
- Origin port
- Destination port
- Shipping line and service
- Planned transit time
- Actual door-to-door time
- Delay reasons when known (port congestion, customs hold, roll-over, etc.)
Over time, this builds a portfolio view of:
- Fast ports
- Slow ports
- Risky transshipment hubs
We then integrate this into:
- FCL cycle planning
- Stock strategy per market
- Route selection (even when freight cost differences are small)
7.Want a Simple Lead Time by Port Tracking Template?
If some of your ports are “famous for being slow” but you don’t have structured data to prove it, it’s very hard to:
- Convince internal teams to adjust stock planning
- Negotiate better expectations with management
- Choose between different ports in the same country
We can share a simple Excel template we use with distributors to:
- Record and compare real lead times by port
- Identify which ports are structurally slow
- Build realistic transit times and safety stock into your planning
With even 6–12 months of data, you can:
- Stop arguing about isolated delays
- Start managing your auto parts supply chain based on real patterns
Contact Our Team
Bruce Gong – Key Account Manager, Beling Filters
Email: bruce.gong@belingparts.com
WhatsApp: +86 150 5776 4729
LinkedIn: www.linkedin.com/in/brucegong-beling
We’re happy to walk through your current ports and routes and see where better planning can remove stress and protect your margin.