In the automotive aftermarket, many distributors face the same painful paradox:
- warehouses full of stock
- but customers still hear: “Sorry, that reference is not available.”
This is not just a logistics problem.
It’s a structure problem – and sometimes the solution is simpler than you think.
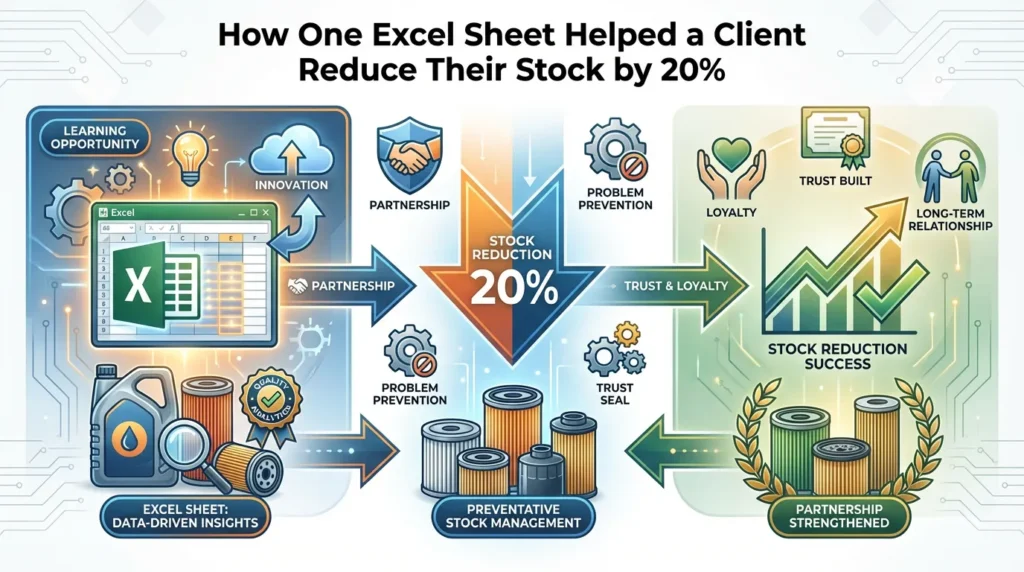
This is the story of how one simple Excel sheet helped a long-term client:
- reduce total stock value by around 20%
- improve service level on fast-moving filters
- free up cash to invest in his own brand
All without buying any new software.
The Classic Aftermarket Problem: Full Warehouse, Empty Shelves
A few years ago, a long-term client told me:
“Bruce, my warehouse is full of filters,
but my customers still complain we are out of stock.”
If you work in the aftermarket distribution business,
you have probably heard (or said) something very similar.
1.1 Too Much Money Sleeping in the Wrong Filters
We looked at his situation and saw the typical pattern:
- ❌ too much money “sleeping” in slow-moving items
- ❌ still missing the references that really sell
In other words:
- he had a high total stock value,
- but a low service level on the products that mattered most.
His first request, like many buyers, was simple:
“Bruce, can you give me better prices?”
From his point of view:
- lower purchase prices = better margins = more profit
But when I looked deeper, I realized that:
- cheaper prices alone would not fix his real problem.
Looking at the Data: The Story Hidden in His Order History
Before answering with another discount,
I decided to review his order history.
2.1 What the Order Pattern Revealed
When I pulled his order data from our system, I saw:
- some references were ordered every month in small quantities
- some references were ordered once a year in big quantities
- many part numbers were ordered so rarely that they were essentially dead stock
This mix told me something important:
- his purchasing decisions were not based on a clear structure.
- orders were probably driven by:
- immediate customer complaints
- sales team pressure
- occasional big deals
not by a data-based inventory strategy.
2.2 Asking for 12 Months of Sales Data
Instead of going back to him with a new price list,
I asked for something else:
“Can you send me 12 months of your sales data?”
He agreed and sent me:
- a messy Excel file
- some missing references
- inconsistent formats
- mixed dates and descriptions
It didn’t look very impressive –
but inside this “mess”, there was everything we needed to start improving.
Cleaning and Structuring the Excel: Simple, Not Fancy
We decided to work through the file together.
3.1 Organizing the Data by Reference, Volume, and Frequency
Step by step, we cleaned and sorted his Excel:
- 📊 by reference (each filter part number appearing only once)
- 📊 by annual sales quantity
- total units sold per reference over the last 12 months
- 📊 by order frequency
- how many times each reference was ordered during the year
This process was not about complex formulas.
It was about seeing the reality clearly:
- which filters moved regularly
- which filters moved occasionally
- which filters almost never moved
When we finished, the picture was much clearer.
3.2 Creating a Simple A/B/C Classification
Next, we created a very simple A/B/C classification.
It looked like this:
- 🅰 Fast movers
- top 20% of references
- representing around 60–70% of total volume
- these are the references that really drive business
- 🅱 Medium movers
- the next 30–40% of references
- consistent, but not dominant in volume
- 🅲 Slow movers
- the remaining references
- low volume, low frequency
- often “nice to have” or very specific parts
This is a classic inventory concept (similar to ABC analysis),
but many distributors never take the time to apply it in a disciplined way.
Once we tagged each reference as A, B, or C,
we could finally talk about strategy, not just prices.
Different Strategy for A, B, and C References
The key insight was simple:
Not every filter reference should be treated the same way.
We adjusted the purchasing strategy for each group.
4.1 Strategy for A Items – Fast-Moving Filters
For A – fast movers, we agreed to:
- 🅰 Keep higher safety stock
- run out of slow movers? Annoying.
- run out of fast movers? Disaster.
- these are the items that drive customer satisfaction and sales
- 🅰 Negotiate better prices based on realistic volume
- because they move regularly,
we can plan higher production quantities on our side - this allowed us to support him with better volume-based pricing
- 🅰 Order more frequently, but in smarter quantities
- instead of small, irregular orders
- we planned regular replenishment cycles
- aligning with his sales rhythm and our production planning
The goal:
- very high availability on fast movers
- lower risk of stock-outs
- better turnover, not just more boxes in the warehouse
4.2 Strategy for B Items – Medium Movers
For B – medium movers, we decided to:
- 🅱 Keep them in the range, but be careful
- these references are necessary to complete the range
- customers expect them, but they don’t dominate volume
- 🅱 Avoid “over-buying”
- no big speculative orders
- avoid tying up too much cash in medium-speed items
We defined more moderate:
- minimum stock levels
- maximum stock levels
to keep availability without over-investing.
4.3 Strategy for C Items – Slow Movers
For C – slow movers, we changed the approach dramatically:
- 🅲 Reduce SKUs where possible
- check for overlap or very similar references
- sometimes we could merge or standardize around a smaller set
- 🅲 Use “buy only on confirmed order” for some references
- instead of keeping everything on the shelf “just in case”
- he would order certain items only:
- when he had a firm order from a customer
- or when there was a special project
This freed a lot of working capital that had been frozen in rarely-used stock.
The Excel Template: Minimum, Maximum, and Review Date
To make the new strategy practical,
we added three very simple but powerful columns in his Excel:
- Minimum stock
- Maximum stock
- Next review date
5.1 Minimum Stock
This is the alert level:
- when the quantity of a reference drops below this number,
it’s time to prepare the next order
For A items:
- the minimum is higher, because they move faster
For C items:
- sometimes the minimum is zero,
meaning “only order when necessary.”
5.2 Maximum Stock
This is the ceiling:
- the quantity above which he does not want to go
It helps him avoid:
- buying too much “just to get a better price”
- filling the warehouse with slow movers
- tying up cash that could be used to promote his own brand
5.3 Next Review Date
Inventory is not “set and forget”.
We added a “next review date” for each reference or group of references:
- A items: reviewed more frequently
- B and C items: reviewed less often
On each review date, he would:
- check actual sales vs. plan
- adjust minimum and maximum if needed
- slowly improve the structure based on real data
5.4 No Expensive Software Needed
Important detail:
- we did all of this in one Excel sheet.
No expensive ERP modules.
No new inventory management software.
No complex IT project.
Just:
- a clear table
- simple logic
- the discipline to update it monthly
That was enough to make a serious difference.
The Results After Six Months: Less Stock, Better Service
Six months after implementing this system,
he shared his numbers with me.
The changes were impressive:
- 📉 Total stock value down by around 20%
- less cash sleeping on the shelves
- more financial flexibility
- 📦 Service level on fast movers much better
- fewer stock-outs on critical items
- happier customers
- fewer urgent “please ship now” emails
- 💰 More cash available to promote his own brand
- instead of investing in unnecessary stock,
he could invest in:- marketing
- private label packaging
- catalogues and promotions
He told me:
“Bruce, I thought I needed lower prices.
Actually, I needed better structure.”
This sentence summarizes a common misunderstanding in B2B:
- many buyers think their main problem is price
- often, their main problem is how they buy and manage stock
The Lesson: Real Partnership Goes Beyond Selling Filters
This experience taught both of us an important lesson.
7.1 Suppliers Often Focus Only on What They Sell
Most suppliers naturally focus on:
- price
- product quality
- packaging
- logistics
All of these are important.
But they are not the full story.
If the distributor:
- buys the wrong mix
- keeps too much of the wrong filters
- runs out of the right ones
then everyone suffers:
- the distributor loses sales
- the mechanics are frustrated
- 最终用户会遇到延误。
- 供应商被指责存在“库存问题”。
即使根本原因是结构性的。
7.2 真正的合作伙伴关系始于帮助客户管理他们的购买方式
真正的伙伴关系始于我们帮助客户之时:
- 分析他们的销售和库存数据
- 将它们的范围分为 A/B/C 类
- 定义:
即使是像精心设计的 Excel 表格这样简单的东西也能:
它并不能取代现代系统,
但它通常可以提供以下功能:
- 清晰的 逻辑
- 这些功能随后可以集成到更高级的工具中。
如果您想查看您的筛选范围或库存策略
如果您正在与以下人员合作:
你在这个故事中看到了自己的影子:
- 高股票价值
- 但仍然缺少重要的参考文献
- 持续的压力迫使价格下降
那么,下一步或许不仅仅是就每件商品的价格进行谈判,
而是应该重新审视一下你的库存结构。
我很乐意:
- 共享同一个简单的 Excel 模板
- 带你了解:
- 如何对参考文献进行分类
- 如何设置最低和最高库存
- 如何针对 A、B 和 C 类项目制定不同的策略
这并非不惜一切代价向您推销更多滤芯,
而是为了帮助您:
- 更智能地销售
- 更明智地投资
- 以更可控、更盈利的方式发展您的业务。
如果这听起来有用,请随时联系我:
📩 bruce.gong@belingparts.com
🌐 www.belingparts.com
有时,企业最有效的改进
并非来自新产品或新供应商,
而是来自利用你已有的数据——这些数据
被整理成一个清晰实用的 Excel 表格。