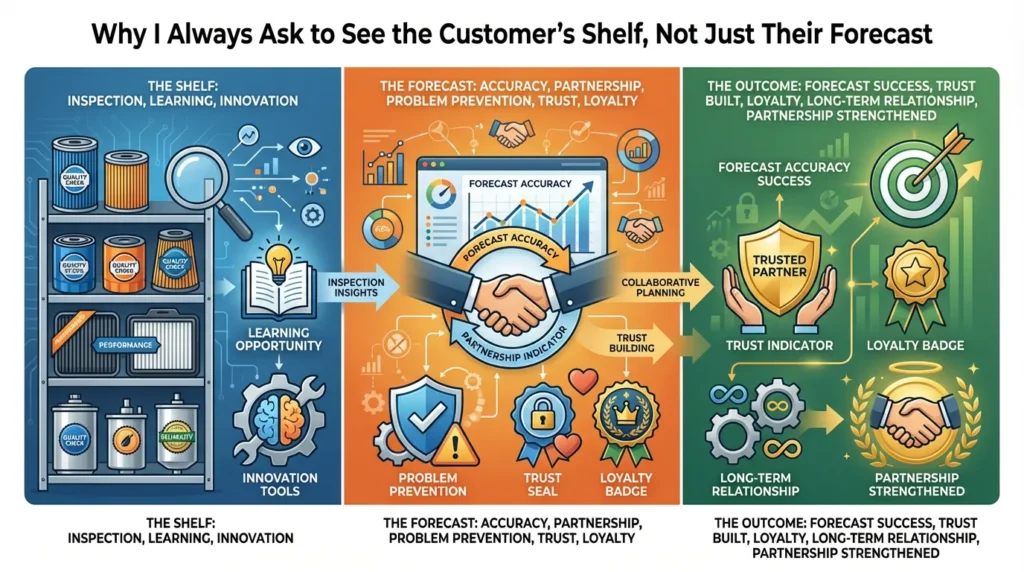
In the automotive aftermarket, every distributor has at least two versions of their business:
- the Excel version – neat forecasts, growth plans, PowerPoint charts
- the shelf reality – dusty boxes, “hero” references, mechanics’ habits
Both matter. But when they fight each other, the shelf usually wins.
This is why, whenever a new distributor wants to start with our filters,
I don’t only look at their forecast.
I ask a simple question:
“Can I see your shelves?”
This one question has helped us and our partners:
- avoid dead stock
- focus on real fast movers
- build healthier first orders
- and still reach the same (or better) container volume –
with a much smarter mix.
Let me show you one example.
The Confident Forecast: “Bruce, I Can Sell 3 Containers”
A few years ago, I was visiting a distributor who wanted to start working with our filters.
Before the meeting, he sent me a very confident Excel forecast:
“Bruce, I can sell 3 containers in the first year.”
The spreadsheet looked impressive:
- 📊 part numbers
- 📊 monthly quantities
- 📊 a clear 12‑month plan
From a distance, it looked perfect:
- clear ambition
- structured planning
- serious commitment
But over the years, I’ve learned an important truth:
Forecasts often show intention,
not necessarily reality.
Many distributors are optimistic.
They want to show their suppliers that they are serious.
And sometimes, they honestly believe the numbers they write.
That’s why I now always do something extra.
The Question He Didn’t Expect: “Can I See Your Shelves?”
When I arrived at his office, we had coffee, discussed the market, and reviewed his Excel.
Then I asked:
“Can I see your shelves?”
He looked a bit surprised.
Most suppliers are happy to stay in the meeting room and talk about:
- prices
- payment terms
- marketing plans
But if you really want to understand a distributor’s business,
you need to see:
- how products live in the warehouse
- how mechanics really buy
- which references are moving and which are just… decoration
So we walked into his warehouse.
What the Shelf Showed That Excel Didn’t
Inside the warehouse, I paid attention to a few specific things.
3.1 Eye Level, Dust, and Picking
I looked at:
- 👀 Which brands were at eye level
- These are the brands the distributor wants to push
- Also often the brands the mechanics naturally grab
- 👀 Which references had dust on the boxes
- Dust means low rotation
- These items “sleep” on the shelf, tying up cash
- 👀 How many items were packed for fast picking
- Easy access usually means higher rotation
- If something is close to the counter, it’s usually a real mover
Within a few minutes, I started seeing patterns that the Excel didn’t show.
3.2 The “Forecast Stars” on the Top Shelves
I noticed something interesting:
- Some of the part numbers that were “forecast stars” in the Excel
were actually sitting on the top shelves, hard to reach. - Mechanics rarely went there.
- Boxes looked like they had been there for a long time.
If these references were truly “top sellers” as forecasted,
they would not be hidden on the third or fourth level.
They would be:
- at eye level
- close to the counter
- easy to access
But they weren’t.
3.3 The “Silent Heroes” in One Corner
At the same time, I saw a different picture:
- Some competitors’ filters were double-faced at eye level
- There was one area where mechanics kept going again and again
- The same 20–30 references were picked constantly
I asked his sales guy:
“Which part numbers do mechanics ask for
without even checking the catalogue?”
He pointed to one section and said:
“These are the real heroes.
If we don’t have them, they just go to another shop.”
These were:
- high-rotation references
- always in demand
- the true core business of his filter sales
Yet, when we later compared them with his forecast, something didn’t match.
Comparing Forecast with Shelf Reality
We went back to the meeting room and put the two worlds side by side:
- the Excel forecast
- the real shelf behavior
4.1 Many “Forecast Stars” That Barely Moved
When we matched the forecast list with real sales and shelf observations, we found:
- ❌ many “forecast stars” that barely moved:
- references with big quantities in the forecast
- but very low real rotation in the last 12 months
- often driven by:
- wishful thinking
- one‑time project expectations
- or just guessing
4.2 Many “Silent Heroes” Underestimated in the Plan
We also found:
- ✅ many “silent heroes” – high-rotation filters –
that were not planned to be stocked deeply in his first order.
These were the references that:
- mechanics asked for without a catalogue
- competitors were selling in volume
- brought regular, repeat business
But in his forecast, they appeared with:
- modest quantities
- sometimes not even included in the initial 3‑container plan
In other words:
- we had a mismatch between intention and reality.
Adjusting the Plan: Designing a Healthier First Order
Instead of blindly following the original Excel forecast,
we decided to build a smarter plan together.
5.1 Refocusing on Real Fast Movers
First, we:
- 🔹 Adjusted the initial order to focus on real fast movers
We:
- increased quantities for the 20–30 “hero” references
- made sure the high-rotation items had strong stock levels from day one
- reduced or delayed some of the “forecast stars” that had weak real demand
This meant his cash would be invested more in references that:
- move quickly
- generate repeat orders
- keep mechanics happy
5.2 Creating a Dedicated “Hero Shelf”
Second, we:
- 🔹 Created a “hero shelf” only for high-rotation filters
We helped him:
- identify the most important references for his market
- physically group them in a clearly visible, easy-to-access area
The idea was simple:
- When a mechanic walks in,
the most important filters are right there –
easy to see, easy to pick.
This improves:
- service speed
- perceived availability
- and sales of core lines
5.3 Planning a Second Order Based on Real Sales
Third, we:
- 🔹 Planned a second order after 3–4 months based on actual sales,
not just forecasts.
We agreed:
- the first order focuses on “must-have” fast movers
- after a few months:
- we analyse sell-out data
- we adjust quantities and add more references gradually
- we use reality, not wish lists, to shape the next containers
This step-by-step approach reduced risk and improved cash flow.
The Results After Six Months
Six months later, we looked at the results.
The outcome was very positive:
- 📉 Less dead stock
- fewer boxes sitting untouched on high shelves
- less money frozen in slow-moving or speculative items
- 📦 Higher availability on the references that really matter
- mechanics rarely heard “out of stock” for key items
- the shop became more reliable in the eyes of end customers
- 📈 And yes, he reached almost 3 containers in the first year –
but with a much healthier product mix than the original plan.
So the volume was there.
But the quality of that volume was much better.
Instead of:
- one big, optimistic order that creates storage problems,
he had:
- a structured, phased approach that followed real market behavior.
Why the Shelf Tells the Truth (When Excel Doesn’t)
This experience reinforced something I had already felt many times:
Excel shows intention.
The shelf shows reality.
7.1 What Excel Is Good At
Excel is excellent for:
- planning
- simulating scenarios
- presenting plans to management or suppliers
- tracking orders and stock
But Excel can also hide:
- emotional optimism
- “nice to have” wishes
- guesses that feel good but are not tested in reality
7.2 What the Shelf Reveals Instantly
A walk through the warehouse reveals things no file can show:
- which references have dust on them
- which brands get the best shelf space
- how mechanics move in the space
- which part numbers they grab without thinking
By looking at:
- how many units are stored at convenient heights
- where boxes are damaged or often touched
- where the double-faced or front-facing items are placed
you can infer real rotation and real importance.
And if you talk to:
- the sales team
- the counter staff
- the warehouse picker
you get additional insight that no spreadsheet can give you.
How We Use Shelf Photos and Data With Other Distributors
Of course, I can’t visit every distributor personally.
But the same principle can still work remotely.
8.1 Asking for Shelf Photos and Short Videos
When new or existing distributors discuss:
- first orders
- range extensions
- or stock problems
I often ask them to send:
- photos of their shelves
- or a short video walking through the warehouse
From these visuals, we can see:
- which brands dominate
- how many SKUs are actually visible
- which references look overstocked
- where the “hero area” probably is
This gives context to:
- their numbers
- their forecasts
- their complaints about “too much stock” or “always out of stock”
8.2 Combining Shelf Insight With Sales Data
The best approach is to combine:
- sell‑out data (from their system or a simple Excel)
- shelf photos or a warehouse visit
When these two sources match, we have a strong base to:
- redesign the range
- adjust stock levels
- create a phased ordering plan
- design “hero shelves” and support materials
This is how we move from “wish list forecasting”
to reality-based inventory planning.
The Lesson for Aftermarket Distributors
If you are a distributor in the automotive aftermarket, ask yourself:
- Are your forecasts driven more by wishful thinking or actual shelf movement?
- Do your top forecast items really sit in the best positions in your warehouse?
- Can your team clearly tell you which references are your real heroes?
Because in B2B aftermarket:
You understand a business much better
by looking at where the products sit and how mechanics buy,
not only by reading a forecast file.
When your range and stock strategy reflect:
- what mechanics actually ask for
- how they move through the store
- which part numbers they consider “non‑negotiable”
you:
- reduce dead stock
- increase availability on critical items
- build a stronger reputation as a reliable supplier in your market
If You Want to Optimise Your Filter Range Based on Reality
If you:
- work with air, oil, fuel, or cabin filters
- feel that your stock is high but availability is still weak
- want to base your range decisions on real behavior, not just Excel
I’d be happy to help.
We can:
- review photos or videos of your shelves
- discuss:
- which references are your “silent heroes”
- which items are just “forecast stars” with little movement
- work out a smarter first or next order plan
- design or suggest a “hero shelf” layout for your key filters
This approach:
- doesn’t require new software
- doesn’t ask you to change your entire system
- simply adds real-world insight to your existing numbers
If that sounds useful, feel free to reach out:
📩 bruce.gong@belingparts.com
🌐 www.belingparts.com
Your forecast is important.
But your shelves – and your mechanics – tell the real story.
When both are aligned, your containers don’t just arrive;
they turn into healthy, repeatable business.